SunDash App Icon

SunDash

Professional solar monitoring for iOS. Track production, analyze savings, and measure your environmental impact with precision.

Download on the App Store
SunDash Dashboard showing live solar production

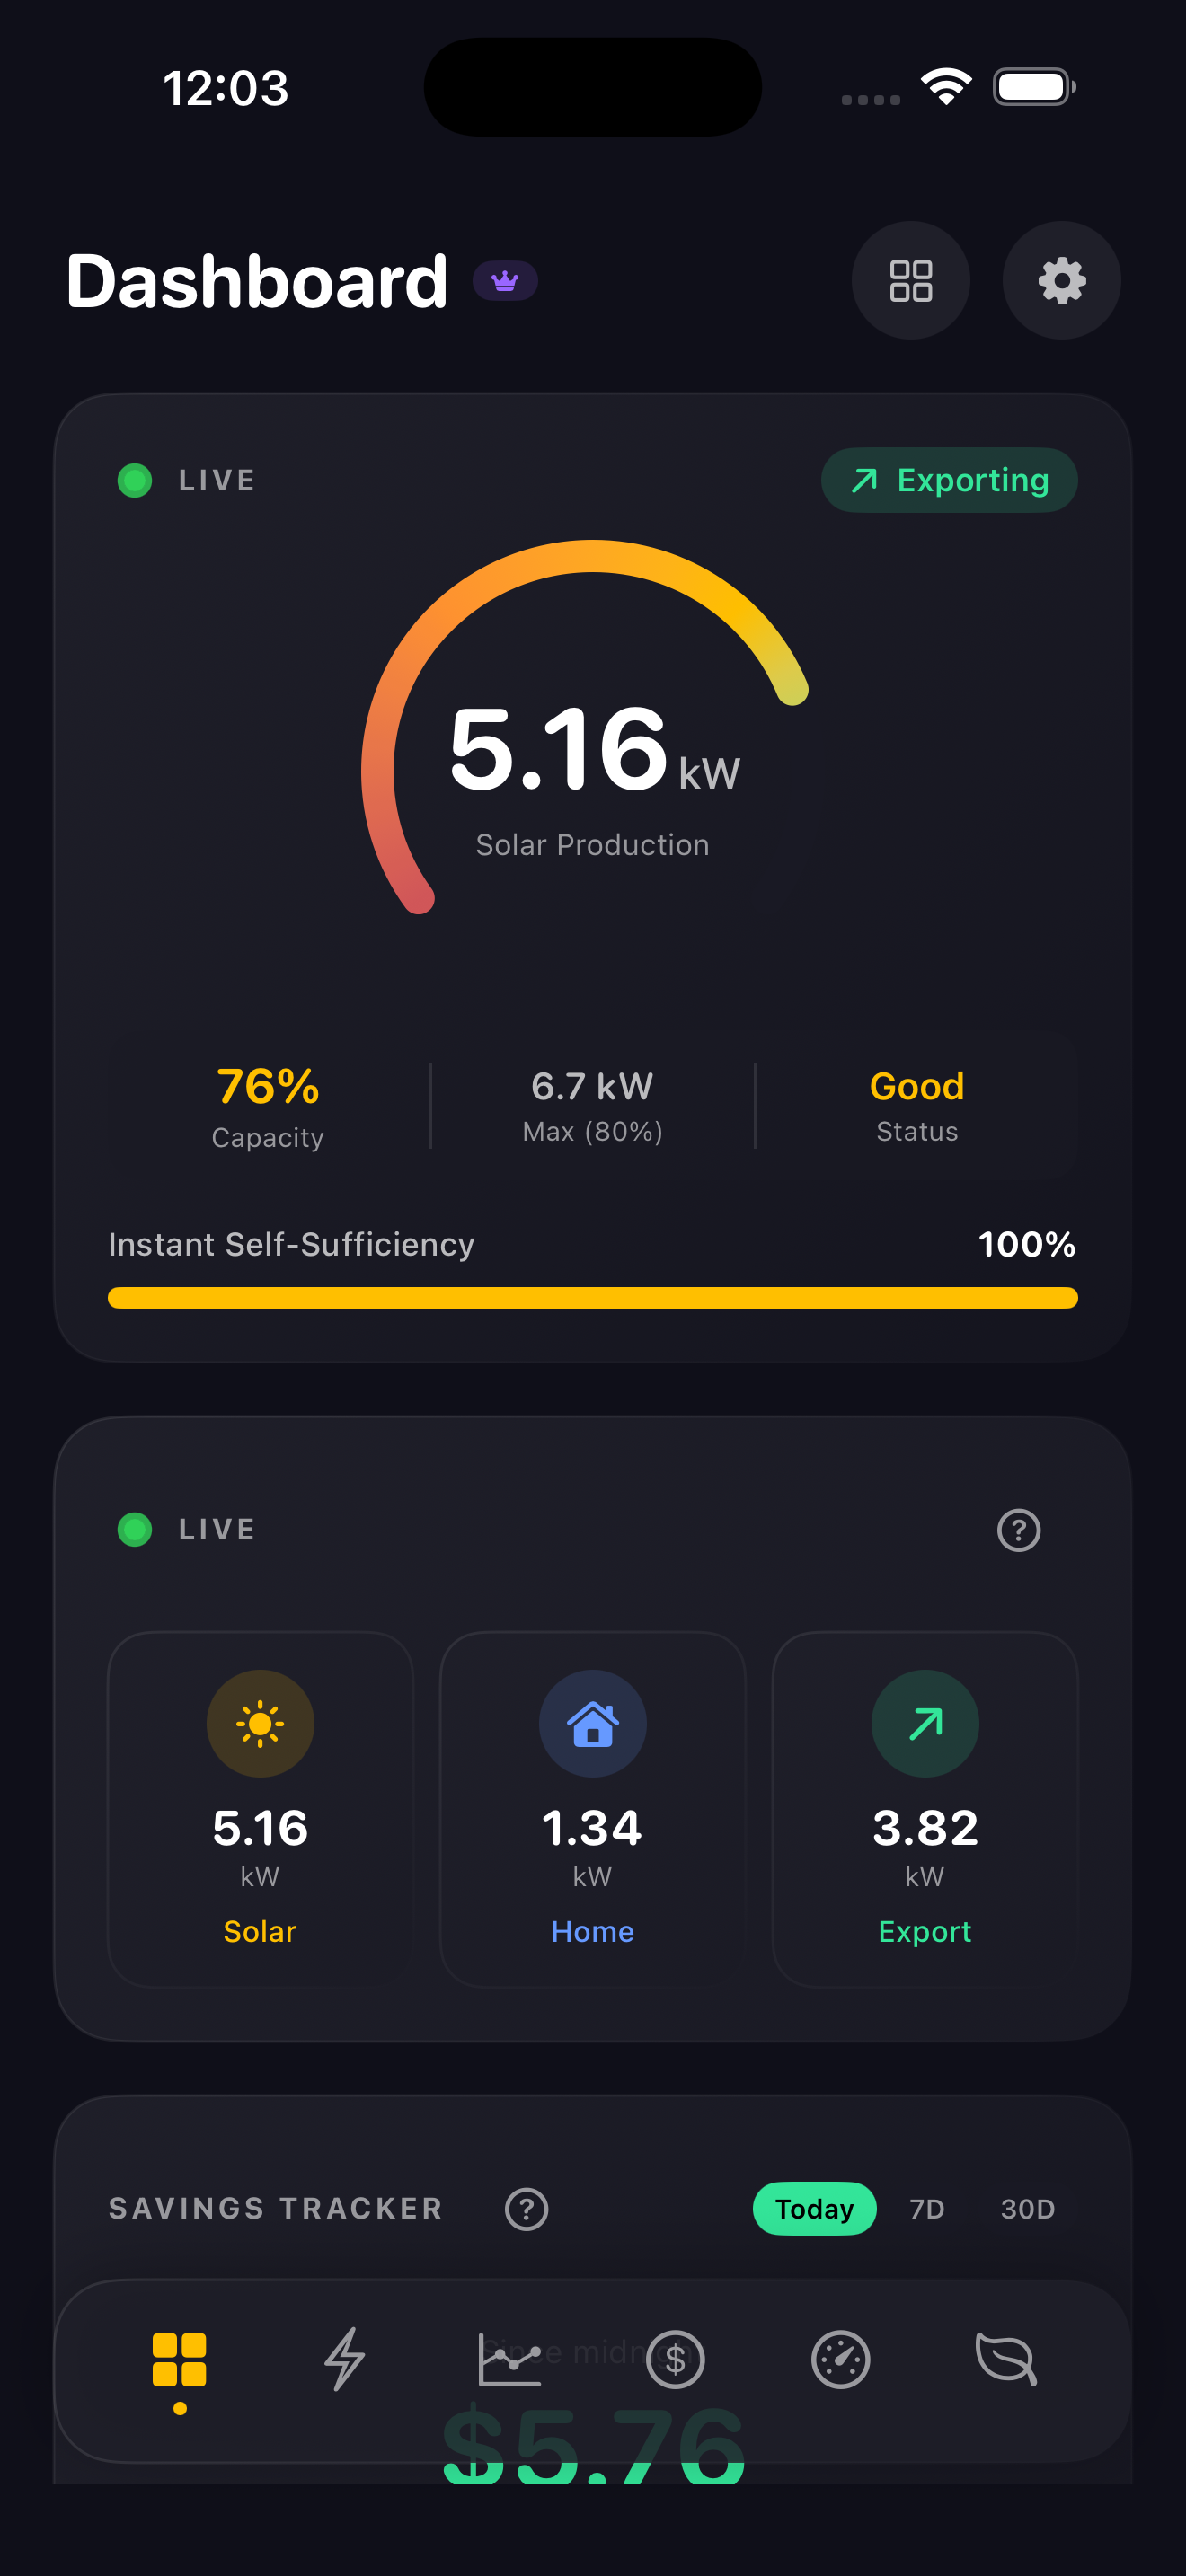
Real-Time Solar Dashboard

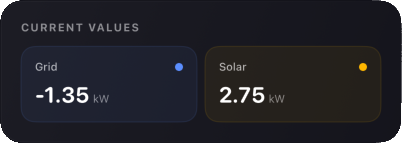
See your solar production at a glance. The live dashboard shows current power generation, home consumption, and grid export - all updated in real-time.

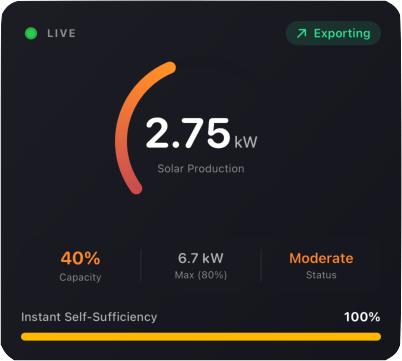
  • Live solar production gauge
  • Instant self-sufficiency tracking
  • Daily savings at your fingertips

31 Dashboard Widgets

Each widget displays specific solar data. Organize them by category: Live, Charts, Financial, Analytics, and Environmental. 10 widgets free forever, unlock all with Premium.

Live Monitoring

Live Solar Production Widget

Live Solar Production Premium

Live solar production with capacity gauge and status. Shows current kW, capacity percentage, daily maximum, and instant self-sufficiency.

Power Flow Widget

Power Flow Free

Animated visualization of energy moving between solar panels, home consumption, and grid. Indicates export or import status with directional flow.

Live Power Flow Widget

Live Power Flow Premium

Animated diagram showing energy flowing between solar panels, home, and grid with real-time directional indicators.

Today's Stats Widget

Today's Stats Premium

Daily energy statistics including total generated, consumed, exported, and imported with running totals.

Current Values Widget

Current Values Free

Side-by-side display of Grid and Solar readings. Negative grid values indicate export to utility.

Charts & History

Power History Chart

Power History Premium

Line chart of Grid and Solar over selectable time ranges: Live, 1H, 24H, 7D, 30D, or custom date range. Dual-axis display.

Production vs Consumption Chart

Production vs Consumption Free

Comparison chart showing solar production against home consumption. Displays net surplus or deficit in kW.

Production Heatmap

Production Heatmap Premium

Calendar-style visualization of daily production over 30, 60, or 90 days. Darker cells indicate higher production days.

Energy Breakdown Widget

Energy Breakdown Premium

Categorized view of Self-Consumed, Exported, and Imported energy with progress bars. Shows total produced and net grid exchange.

Net Energy Flow Widget

Net Energy Flow Premium

Visual flow diagram showing net energy: exporting surplus to grid or importing from utility at a glance.

Financial

Savings Tracker Widget

Savings Tracker Premium

Calculates monetary savings from self-use and export credits. Applies configured electricity rates including TOU pricing.

Electricity Cost Widget

Electricity Cost Premium

Shows cost of grid imports with average rate calculation. Supports TOU (Time-of-Use) rate plan configurations.

Bill Estimate Widget

Bill Estimate Premium

Projects monthly electricity bill using 14-day usage average. Shows billing cycle progress, grid import cost, and solar savings breakdown.

Payback Progress Widget

Payback Progress Premium

Tracks ROI on solar system investment. Displays system cost, total saved, remaining balance, and years to payback.

Lifetime Totals Widget

Lifetime Totals Free

Cumulative statistics: Total Generated, Total Consumed, Grid Export, and Grid Import since system installation.

TOU Rate Widget

TOU Rate Premium

Current Time-of-Use rate period display with today's full schedule. Shows peak, off-peak, and super off-peak rates.

Money Clock Widget

Money Clock Free

24-hour radial clock visualization showing TOU electricity rates throughout the day. Color-coded rate periods.

Analytics AI-Powered

Self-Consumption Widget

Self-Consumption Premium

Percentage of solar production used directly vs exported. Includes optimization tips based on usage patterns.

Performance Ratio Widget

Performance Ratio Premium

Compares actual production against expected output. Factors in Peak Sun Hours (PSH) and weather conditions.

Peak Production Widget

Peak Production Free

Tracks daily production records. Shows current day progress toward beating the all-time high.

Power Distribution Widget

Power Distribution Free

Donut chart showing real-time power source mix: percentage from Grid vs Solar with current kW values.

Solar Forecast

Solar Forecast Premium

Weather-based solar production forecast showing expected generation based on local weather conditions.

Tomorrow's Forecast

Tomorrow's Forecast Premium

AI-powered hourly forecast combining weather data and your system's historical patterns for accurate predictions.

Smart Energy Buddy

Smart Energy Buddy Premium

AI consumption insights with seasonal pattern analysis, 6-month trends, and personalized energy tips.

Period Comparison

Period Comparison Premium

Compare today vs yesterday, this week vs last week, and this month vs last month side by side.

System Status

System Status Premium

Connection health, data freshness, and system info at a glance. Know when your system needs attention.

Monthly Summary

Monthly Summary Premium

Month-to-date totals with projections for end-of-month production and savings estimates.

Goldilocks Heatmap

Goldilocks Heatmap Premium

Hour-by-day heatmap showing when solar production perfectly matches your consumption patterns.

Environmental

CO2 Avoided Widget

CO2 Avoided Free

Calculates carbon offset in tons. Shows equivalents: trees planted, miles not driven, gallons of gas saved.

Green Score Widget

Green Score Free

Gamified sustainability rating based on self-sufficiency, grid contribution, and solar ownership. Points breakdown displayed.

Trees Planted Widget

Trees Planted Free

Visual representation of CO2 offset as equivalent trees. Based on 48 lbs CO2 absorbed per mature tree per year.

Comprehensive Solar Analytics

Monitor every aspect of your solar investment with professional-grade tools designed for homeowners and solar professionals. Integrates real-time weather data for accurate performance analysis and solar forecasting.

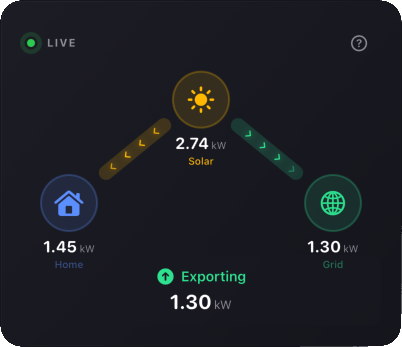
Real-Time Monitoring

Live power flow visualization showing energy moving between solar panels, home consumption, and grid connection.
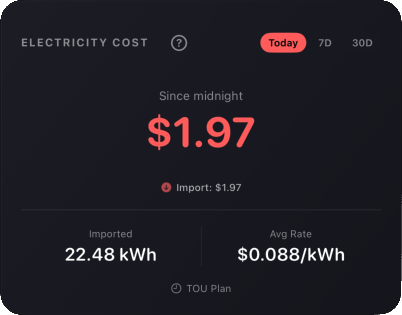
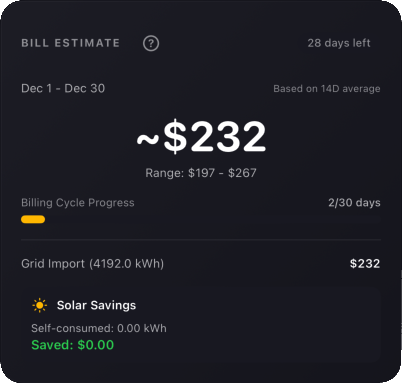
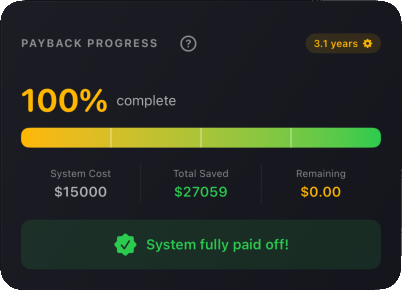
Financial Analytics

Track savings, estimate bills, and monitor ROI with TOU-aware calculations that match your electricity plan.
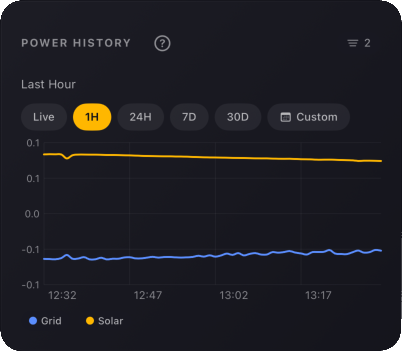
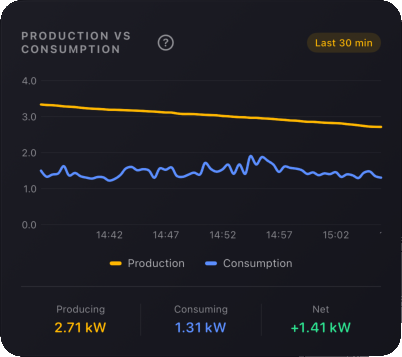
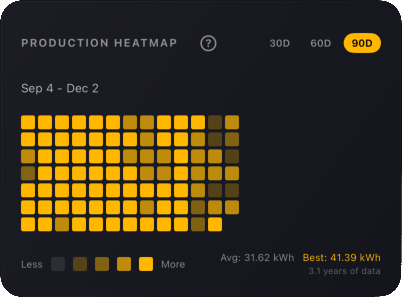
Production Charts

Historical data visualization with heatmap calendars and production vs consumption comparisons.

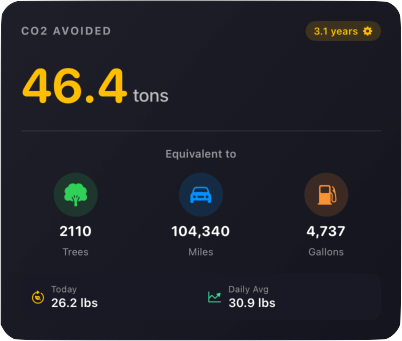
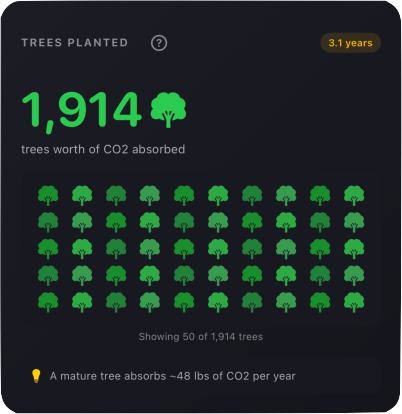
Environmental Impact

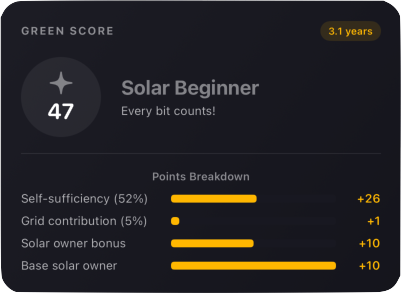
Track CO2 offset, tree equivalents, and sustainability scores to measure your environmental contribution.

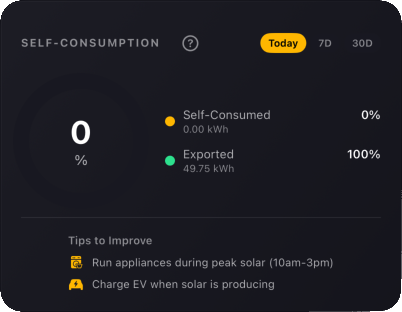
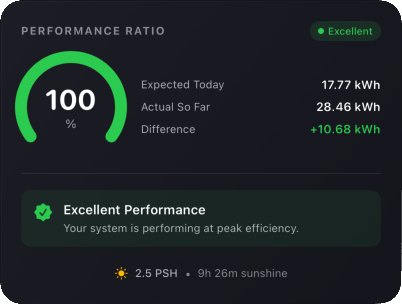
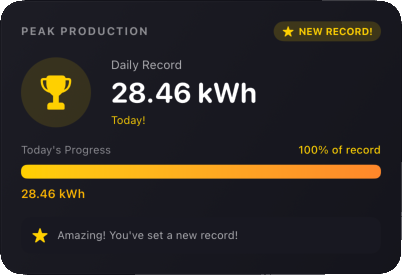
Performance Analytics

Self-consumption ratios, performance metrics, and peak production tracking to optimize your system.

Customizable Dashboard

Arrange widgets by category: Live, Charts, Financial, Analytics, and Environmental views.

Supported Systems

Connect to your eGauge energy monitor with secure local or remote connections.

Fully Supported

eGauge Energy Monitor

Connect via local network or remote URL. Supports all eGauge models with real-time data access.

Choose Your Plan

Start with a 7-day free trial of all Premium features, then continue free with 10 essential widgets or subscribe for the complete solar analytics suite.

Free

Essential monitoring

  • 7-day free trial of all features
  • 10 widgets free forever:
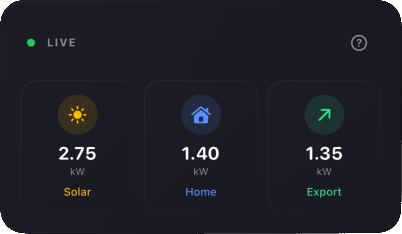
  • Live: Power Flow, Current Values

    Charts: Production vs Consumption

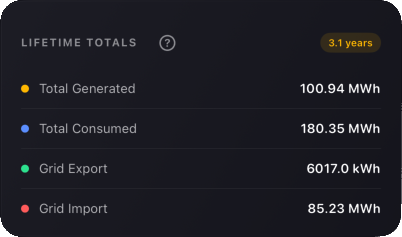
    Financial: Lifetime Totals, Money Clock

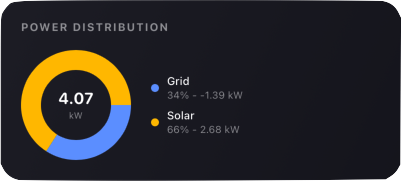
    Analytics: Peak Production, Power Distribution

    Environmental: CO2 Impact, Green Score, Trees Planted

  • Single solar site monitoring
Download on the App Store

Premium

Complete analytics suite

  • Unlimited historical data
  • All 31 widgets unlocked:
  • Live: Live Solar Production, Power Flow, Live Power Flow, Today's Stats, Current Values

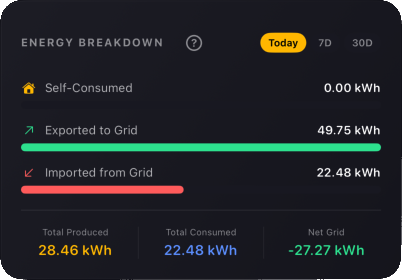
    Charts: Power History, Net Energy Flow, Energy Breakdown, Production vs Consumption, Production Heatmap

    Financial: Savings Tracker, Electricity Cost, TOU Rate, Payback Progress, Bill Estimator, Lifetime Totals, Money Clock

    Analytics: Self-Consumption, Performance Ratio, Peak Production, Power Distribution, Solar Forecast, Tomorrow's Forecast, Smart Energy Buddy, Period Comparison, System Status, Monthly Summary, Goldilocks Heatmap

    Environmental: CO2 Avoided, Green Score, Trees Planted

  • AI-powered solar forecasting
  • Performance alerts & notifications
  • TOU rate plan calculations
  • Data export (CSV & PDF)
  • Multi-site add-on: Monitor multiple properties, vacation homes, or client installations from one app
Download on the App Store

Requirements

Device

  • iPhone or iPad
  • iOS 17.0 or later
  • Internet connection required

Connectivity

  • Local network access for direct device connection
  • Remote access via exposed device URL or cloud APIs
  • Credentials stored securely in iOS Keychain